Data analysis · Recalculated September 2026
The 25 richest counties in America
Ranked by median household income, from our own pass over all 3,143 US counties. Plus the ranking almost nobody publishes: which counties sit furthest above their own state.
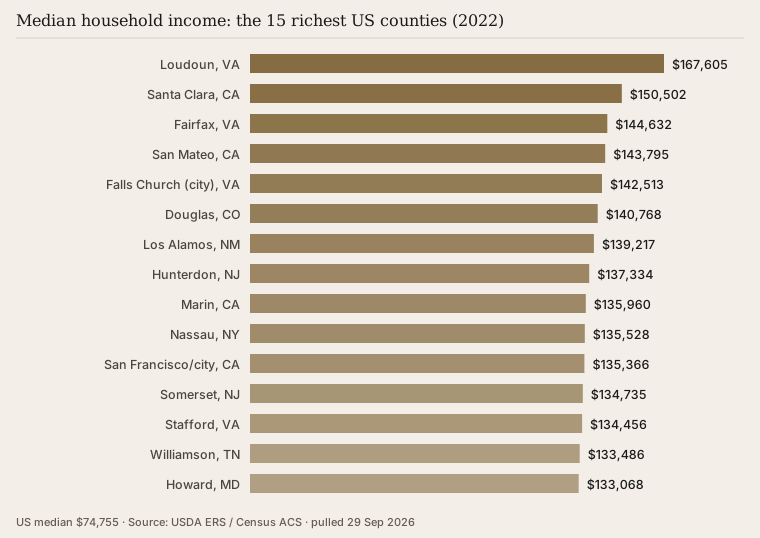
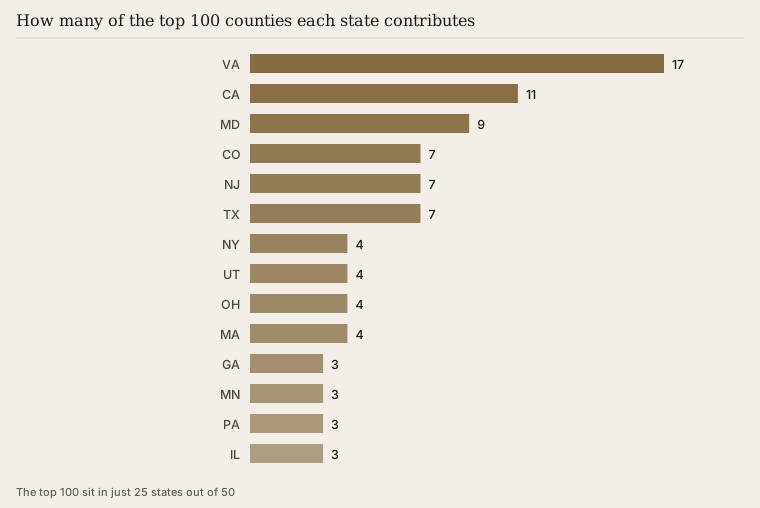
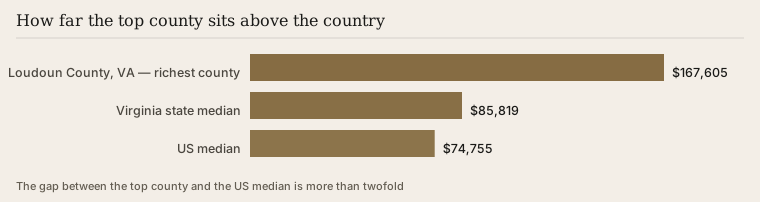
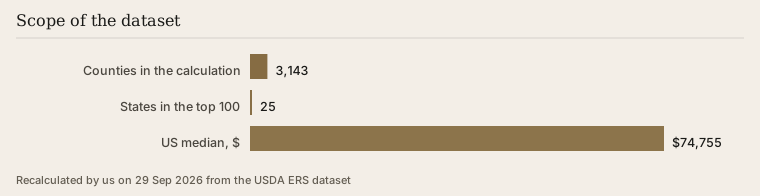
The short version: the richest county in America is Loudoun County, Virginia, at $167,605. The US median is $74,755, so the top county earns more than double the country. Half of the hundred richest counties sit in just 25 states, and 26 of them ring Washington, DC.
On this page
The list
The 25 richest counties in America by median household income
Every county in the United States, ranked. The figures below are median household income for 2022, the most recent year published in the county series we used. The national median for the same year was $74,755.
| # | County | State | Median household income | Share of state median | Unemployment 2023 |
|---|---|---|---|---|---|
| 1 | Loudoun County | VA | $167,605 | 195% | 2.5% |
| 2 | Santa Clara County | CA | $150,502 | 164% | 3.5% |
| 3 | Fairfax County | VA | $144,632 | 168% | 2.5% |
| 4 | San Mateo County | CA | $143,795 | 157% | 3.0% |
| 5 | Falls Church city | VA | $142,513 | 166% | 2.3% |
| 6 | Douglas County | CO | $140,768 | 158% | 2.9% |
| 7 | Los Alamos County | NM | $139,217 | 233% | 1.9% |
| 8 | Hunterdon County | NJ | $137,334 | 142% | 3.5% |
| 9 | Marin County | CA | $135,960 | 149% | 3.3% |
| 10 | Nassau County | NY | $135,528 | 171% | 3.1% |
| 11 | San Francisco County | CA | $135,366 | 148% | 3.3% |
| 12 | Somerset County | NJ | $134,735 | 140% | 3.8% |
| 13 | Stafford County | VA | $134,456 | 157% | 2.9% |
| 14 | Williamson County | TN | $133,486 | 205% | 2.5% |
| 15 | Howard County | MD | $133,068 | 140% | 1.7% |
| 16 | Summit County | UT | $132,358 | 150% | 2.4% |
| 17 | Morris County | NJ | $131,562 | 137% | 3.7% |
| 18 | Arlington County | VA | $131,020 | 153% | 2.1% |
| 19 | Forsyth County | GA | $130,909 | 180% | 2.5% |
| 20 | Teton County | WY | $127,677 | 179% | 2.1% |
| 21 | Rockwall County | TX | $124,291 | 172% | 3.6% |
| 22 | Fairfax city | VA | $122,790 | 143% | 2.4% |
| 23 | Delaware County | OH | $121,528 | 185% | 2.9% |
| 24 | Hamilton County | IN | $117,068 | 175% | 2.8% |
| 25 | Oldham County | KY | $116,173 | 196% | 3.2% |
What is the richest county in America right now
Loudoun County, Virginia. A median household there earns $167,605 a year, which is 195% of the Virginia median and 224% of the national figure. Loudoun sits roughly thirty miles west of Washington, DC, and its income comes from the same three sources that lift most of the region: federal contracting, data centres and the professional services that cluster around both. It is also the county that anchors the Washington end of our matchmaking cost guide.
How the top 10 and top 20 have shifted
The composition of the top 10 is stable, the order is not. Loudoun, Fairfax, Santa Clara and San Mateo have traded places for years without any of them leaving the group. The more interesting movement happens between positions 10 and 25, where fast-growing suburban counties in Tennessee, Georgia, Texas and Utah have displaced older Northeastern entries. Williamson County outside Nashville and Forsyth County outside Atlanta are the clearest examples: neither would have appeared in a top 25 list from a decade ago.
Why several entries are cities, not counties
Virginia has independent cities that are administratively equal to counties, so Falls Church city and Fairfax city appear in the ranking on their own. They are small, densely professional and sit inside the same Washington commuter belt. San Francisco is a combined city and county, which is why it appears once rather than twice.
Where the money sits
Wealthiest counties in the US: 25 states out of 50
The striking part of the data is not who is first. It is how few places are represented at all. Of the hundred richest counties in the country, every single one sits in one of just 25 states. The other half of the United States contributes nothing to the list.
The Washington orbit
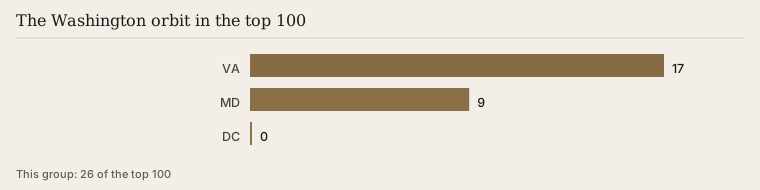
Twenty-six of the top hundred counties sit in Virginia, Maryland or the District of Columbia. No other concentration in the country comes close. Federal employment pays well, federal contracting pays better, and both are geographically fixed in a way that technology and finance are not.
The New York orbit
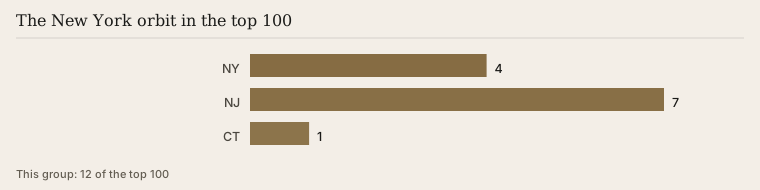
New York, New Jersey and Connecticut together contribute 12. The pattern differs from Washington: the wealth sits in commuter counties rather than in the city, and it is older money spread across a wider ring.
The West
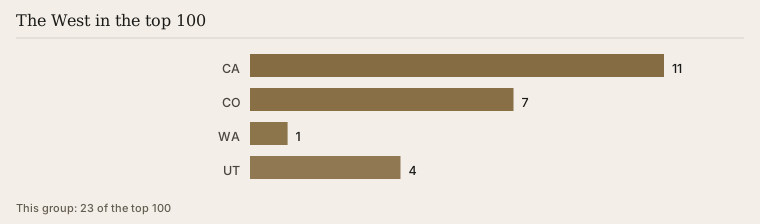
California contributes 11, Colorado 7, and Utah and Washington add a handful between them. California's entries are concentrated almost entirely in the Bay Area rather than spread across the state.
The South
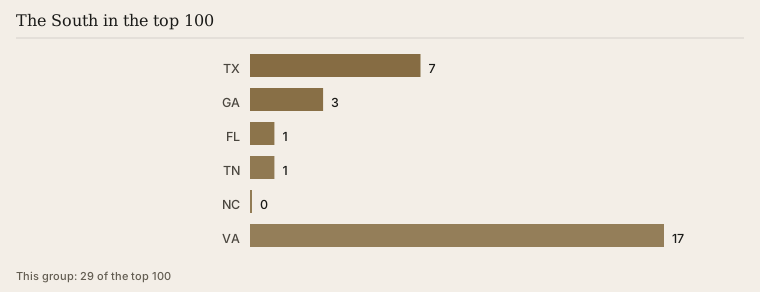
Texas contributes 7 and Georgia, Tennessee, Florida and North Carolina add several more. This is the fastest-changing part of the list, and almost all of it is suburban rather than urban.
The Midwest
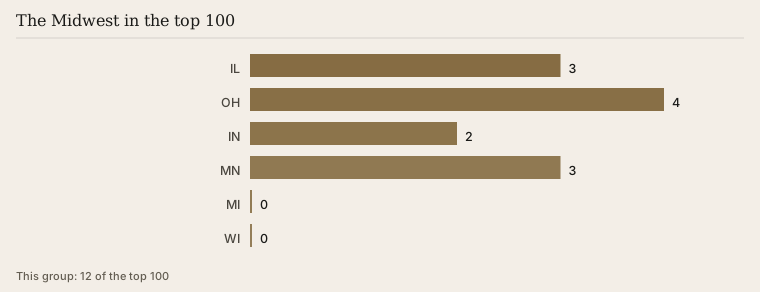
The Midwest is thinly represented. Ohio, Illinois, Indiana and Minnesota contribute a small group, and each of those entries is a single affluent suburban county rather than a regional pattern.
Our own ranking
The ranking nobody publishes: furthest above their own state
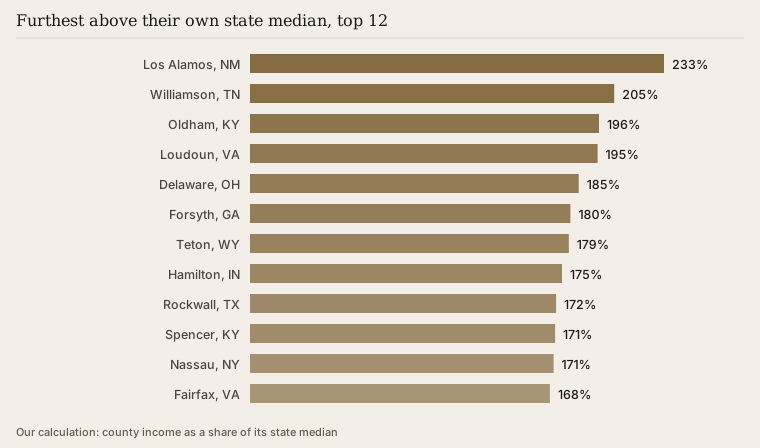
Every list of the richest counties in America ranks by absolute dollars, which quietly measures the same thing as a list of expensive metropolitan areas. We ran a second calculation: how far does each county sit above the median of its own state? That produces a different list, and a more interesting one.
| # | County | State | Median income | Share of state median |
|---|---|---|---|---|
| 1 | Los Alamos County | NM | $139,217 | 233% |
| 2 | Williamson County | TN | $133,486 | 205% |
| 3 | Oldham County | KY | $116,173 | 196% |
| 4 | Loudoun County | VA | $167,605 | 195% |
| 5 | Delaware County | OH | $121,528 | 185% |
| 6 | Forsyth County | GA | $130,909 | 180% |
| 7 | Teton County | WY | $127,677 | 179% |
| 8 | Hamilton County | IN | $117,068 | 175% |
| 9 | Rockwall County | TX | $124,291 | 172% |
| 10 | Spencer County | KY | $101,552 | 171% |
Why Los Alamos comes first
Los Alamos County ranks seventh by absolute income and first by this measure. The reason is that New Mexico is a low-income state and Los Alamos is a national laboratory town, so a single employer produces an income island with nothing comparable around it. By dollars it is an ordinary member of the top 10. By local contrast it is the most extreme place in the country.
What this ranking actually shows
Absolute income tells you where expensive metropolitan areas are. Relative income tells you where wealth is concentrated rather than widespread. Kentucky appears twice in the top 10 of this list and never in the absolute top 20, because Oldham and Spencer counties are affluent pockets in a state that is not.
State by state
The richest county in every state, including California, Texas and Georgia
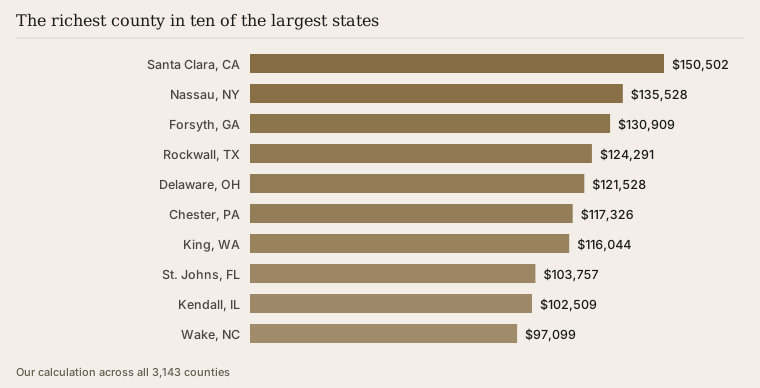
Ranking nationally hides the local answer. Below is the leading county in ten of the largest states, taken from the same pass over all 3,143 counties.
| State | Richest county | Median household income |
|---|---|---|
| California | Santa Clara County | $150,502 |
| New York | Nassau County | $135,528 |
| Georgia | Forsyth County | $130,909 |
| Texas | Rockwall County | $124,291 |
| Washington | King County | $116,044 |
| Florida | St. Johns County | $103,757 |
| Illinois | Kendall County | $102,509 |
The Texas answer surprises people
Rockwall County is a small county east of Dallas, not one of the large well-known Texas counties. It leads the state at $124,291, which is 172% of the Texas median. Travis County, which contains Austin, does not lead its own state. The same pattern shows up in our guide to elite dating in the USA: the money sits in the commuter ring, not the city.
Florida sits lower than its reputation
St. Johns County near Jacksonville leads Florida at $103,757. That is a long way below the national top 25, and it reflects something real, the same way the Nigerian market concentrates in two cities: Florida concentrates wealth in retirement and coastal enclaves that are smaller than a county, so the county average absorbs them.
Units matter
Richest zip codes in America compared with richest counties
Searches for the richest zip codes in the USA and the richest counties look like the same question. They are not, and the two lists barely overlap.
Why the lists differ
A zip code can contain a few thousand households. A county can contain a million. When a single wealthy enclave sits inside a large county, it dominates the zip code ranking and disappears into the county average. That is why the best-known wealthy zip codes in California and New York sit inside counties that are prosperous but not national leaders.
Which unit answers which question
If the question is where do rich people live, a zip code list is the sharper instrument. If the question is which places are broadly affluent rather than locally unequal, the county figure is the honest one, and the share-of-state calculation above is sharper still.
Richest neighborhoods in America
Neighborhood rankings are narrower again, and they are the least comparable of the three. A neighborhood has no fixed statistical boundary, so published lists are built from different definitions and cannot be lined up against each other or against the county figures on this page.
Wealthiest cities in America against wealthiest counties
City rankings sit between the two. A city boundary often excludes the affluent suburbs that lift the county, which is why a wealthiest cities list and a wealthiest counties list can disagree about the same metropolitan area.
What a median hides
Rich county, high unemployment
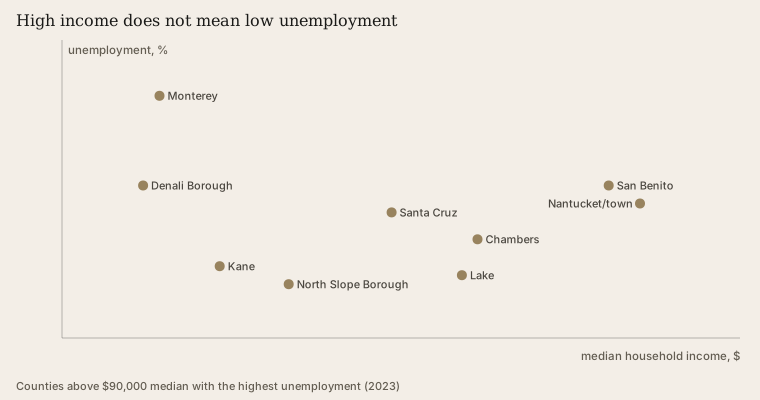
A high median household income is often read as a sign that everyone in the county is doing well. The data does not support that reading.
Monterey County, California
A median household income of $91,450 and unemployment of 7.0% in 2023. Seasonal agriculture and tourism sit alongside a high-earning professional population, and the median lands between two groups rather than describing either.
Nantucket, Massachusetts
A median of $107,613 with unemployment at 5.8%. The island economy is sharply seasonal, so the annual figures describe an average of two very different halves of the year.
What to take from this
A median is the middle value, not the typical experience. In counties where the income distribution has two peaks, the median describes a household that may barely exist. Any ranking built on medians, including the one at the top of this page, carries that limitation.
Definitions
What richest actually measures, and what it misses
Median versus average household income
The median is the middle household. The average is the total divided by the number of households, which a small number of very large incomes can pull upward dramatically. Every figure on this page is a median, which is the more conservative and more representative of the two.
Income is not wealth
This series measures what households earn in a year. It says nothing about what they own. A county of high earners with large mortgages and a county of asset-rich retirees can look completely different in reality and similar in this table. If you arrived here from a search about millionaire and elite dating, that distinction matters: a high county median indicates professional salaries, not accumulated fortunes.
Cost of living is not subtracted
None of these figures adjust for what it costs to live in the place. Santa Clara County and Oldham County are both affluent, and a dollar goes a great deal further in Kentucky. A ranking adjusted for local prices would move the Bay Area entries down and the Southern and Midwestern entries up, sometimes by many places.
Households are not people
Household income depends on how many earners share a roof. Counties with more two-earner households rank higher without any individual earning more, which is part of why suburban commuter counties dominate these lists. The Canadian and Australian markets concentrate differently again.
The other end
The other end of the same table
A ranking of the richest counties is only half of a distribution. The same file contains the other half, and the distance between the two ends is larger than most readers expect.
| County | State | Median household income |
|---|---|---|
| McDowell County | WV | $28,972 |
| Buffalo County | SD | $30,659 |
| East Carroll Parish | LA | $30,688 |
| Holmes County | MS | $31,972 |
| Owsley County | KY | $32,783 |
The gap is 5.8 times
Loudoun County, Virginia, at $167,605 and McDowell County, West Virginia, at $28,972 sit in the same country under the same statistical definition. A typical household in the first earns 5.8 times what a typical household in the second earns.
How the whole distribution looks
Of the 3,143 counties, 108 have a median household income at or above $100,000 and 590 sit below $50,000. The affluent tail is much thinner than the lists at the top of this page suggest, which is worth holding in mind when a ranking shows only the first 25 entries.
A statistical catch
Why the median county is poorer than the median household
Two medians describe the United States in this dataset, and they disagree by nearly fourteen thousand dollars. Both are correct.
The two numbers
The median American household earns $74,755. The median American county has a median household income of $60,833. The second figure is lower because counties are counted one each, regardless of how many people live in them.
Why the difference exists
Wealthy counties tend to be populous. Los Angeles, Santa Clara, Fairfax and Nassau each hold hundreds of thousands of households, while the lowest-income counties in the table above hold a few thousand. Counting places equally gives rural low-income counties the same weight as large affluent ones, and the unweighted middle lands well below the population-weighted one.
What it means for any county ranking
A statement like half of American counties earn under $60,833 is true and describes places. A statement like half of American households earn under $74,755 is also true and describes people. Rankings of the richest counties, including this one, describe places. They are not a description of where most Americans live.
Methodology
How we produced these numbers
Everything above comes from one pass over one official file, run by us rather than copied from another ranking.
The source
The county-level series Unemployment and median household income for the United States, States, and counties, 2000 to 2023, published by the USDA Economic Research Service and last updated on 31 January 2025. Income within that file originates from the American Community Survey run by the US Census Bureau. Unemployment originates from the Local Area Unemployment Statistics programme at the Bureau of Labor Statistics.
The vintage, stated plainly
Median household income in that file runs to 2022 and unemployment runs to 2023. We downloaded and recalculated it on 29 September 2026. Where other rankings cite a later income year, they are using a different release, and the ordering at the top changes very little between releases.
What we calculated ourselves
We parsed all 3,143 county records, ranked them by median household income, expressed each county as a percentage of its own state median, cross-referenced unemployment, and counted the state distribution of the top 100. The share-of-state ranking and the state distribution count are ours. Definitions for every variable are published by the Census Bureau.
What we did not attempt
We did not rank zip codes or neighborhoods, because this series does not contain them, and we will not publish a ranking we have not measured. We also did not produce demographic breakdowns of these counties for the same reason. Geographic definitions for counties and equivalent entities are maintained by the Census Bureau geography programme.
Where this sits on the site
This page is a data reference, not advice. If you came looking for the dating side of the subject, our guide to what elite matchmaking really costs covers the paid end of the market, and the country guides for the USA and the United Kingdom cover how elite dating works in each.
Questions
Richest counties in America: frequently asked
What is the richest county in America?
Loudoun County, Virginia, at $167,605 median household income. That is more than twice the national median of $74,755.
What are the top 10 richest counties in America?
Loudoun VA, Santa Clara CA, Fairfax VA, San Mateo CA, Falls Church city VA, Douglas CO, Los Alamos NM, Hunterdon NJ, Marin CA and Nassau NY. Seven of the ten sit beside Washington, DC, or in the San Francisco Bay Area.
What are the top 20 richest counties in America?
The ten above, followed by San Francisco CA, Somerset NJ, Stafford VA, Williamson TN, Howard MD, Summit UT, Morris NJ, Arlington VA, Forsyth GA and Teton WY.
Which county is furthest above its own state?
Los Alamos County, New Mexico, at 233% of the state median. It is seventh by absolute income and first by local contrast.
How many states hold the 100 richest counties?
Twenty-five, exactly half of the country. Virginia contributes 17, California 11 and Maryland 9.
Are the richest zip codes the same as the richest counties?
No. A zip code is small enough for one wealthy enclave to dominate it, while a county averages that enclave with everything around it.
What is the richest county in California, Texas and Georgia?
Santa Clara at $150,502, Rockwall at $124,291 and Forsyth at $130,909.
Can a rich county have high unemployment?
Yes. Monterey County, California, combines $91,450 median income with 7.0% unemployment.
Does a high median mean the residents are millionaires?
No. The figure measures annual earnings, not accumulated wealth, and the two are not the same thing.
How current is this data?
Income is for 2022 and unemployment for 2023, from a file updated on 31 January 2025 and recalculated by us on 29 September 2026.
Reviewed by the Millionaires Dating editorial team. Published 29 September 2026. This page is a statistical reference and carries no affiliate links. Elsewhere on this site some outbound links are affiliate links, meaning we may earn a commission at no cost to you; that never affects what is written.
Sources. USDA Economic Research Service, Unemployment and median household income for the United States, States, and counties, 2000 to 2023, updated 31 January 2025, downloaded 29 September 2026 · US Census Bureau, American Community Survey, five-year estimates, income year 2022 · US Bureau of Labor Statistics, Local Area Unemployment Statistics, 2023 · US Census Bureau income definitions and geography programme. All rankings, share-of-state calculations and state distribution counts on this page were computed by us from the file named above.